UPSTaRT Summer Research 🔬
DataPulse: An Interactive Dashboard for Statistical and Exploratory Analysis of Multimodal Healthcare Data in Shiny.
View the Research Poster
Intro
This summer, I had the privilege of participating in the UPSTaRT (S&E Undergraduate Programme of Summer Training and Research Track) at UL. With the support of Prof. Conor Ryan and Dr. Meghana Kshiragar, I contributed to the project: “Discovering Novel Biomarkers for Pan Cancers.” I also collaborated closely with my classmate, James Conolly. This post details my experiences, methodologies, and outcomes from this research project. The final output of our work was later named DataPulse.
Motivation
The primary motivation behind this project was to develop a tool capable of providing summary statistics and identifying data biases across various modalities, including tabular clinical data, genomic data, and imaging data (e.g., CT, MRI, and fMRI scans). Addressing data bias is critical, as it ensures the accuracy and generalizability of research findings, especially in a diverse field like cancer research.
Meetings
During this programme I have been attending weekly meetings with my mentor and two other interns. The purpose of those meetings was to discuss our progress, receive feedback and plan the next steps. We were also having a lab meeting every Monday, in which we shared our progress with the whole BDS (Biocomputing and Development Systems) group.
Week 1 and Week 2 (Onboarding and Initial Development)
27th May - 3rd June
I began by familiarizing myself with R, RStudio, and ShinyApp. This involved completing the Learn R course on Codecademy, watching relevant YouTube tutorials, and exploring the Get Started guides on the official Shiny website. Additionally, I reviewed several key papers provided by my advisors to better understand the project’s biological context and goals.
3rd June - 10th June
I developed the first version of my R Shiny App to visualize a Lung Adenocarcinoma clinical dataset from cBioPortal. The app was hosted on Shinyapps.io, providing an accessible platform for data exploration.
Week 3 and Week 4 (Expansion and DICOM Viewer)
10th June - 17th June
I expanded the app to include additional clinical datasets, allowing users to select specific datasets for analysis. I also incorporated feedback from my advisors during a progress presentation, focusing on enhancing the app’s functionality and user interface.
17th June - 24th June
To facilitate reproducibility and transparency, I created an R Markdown notebook that documents the data analysis process. Additionally, I integrated an image dataset containing CT scans of non-small cell lung cancer patients. This dataset can be explored using a DICOM Viewer feature within the app.
Week 5 and Week 6 (Interactivity and Statistical Analysis)
24th June - 1st July
I enhanced the app by making plots interactive using the Plotly package. I also introduced a correlation matrix for numeric data in clinical datasets, facilitating the identification of potential relationships between variables. Additionaly, I gave a presentation in Culhane Lab (School of Medicine) on the topic “Data bias visualisation tool”.
1st July - 7th July
Based on feedback from the Culhane Lab, I incorporated the table1 R package, enabling stratified analysis of clinical data based on user-selected category variables. This functionality is particularly useful for identifying data biases. Additionally, I updated the user interface was with styled tab headings for improved navigation.
Week 7 and Week 8 (T-test and Radiogenomic Analysis)
7th July - 15th July
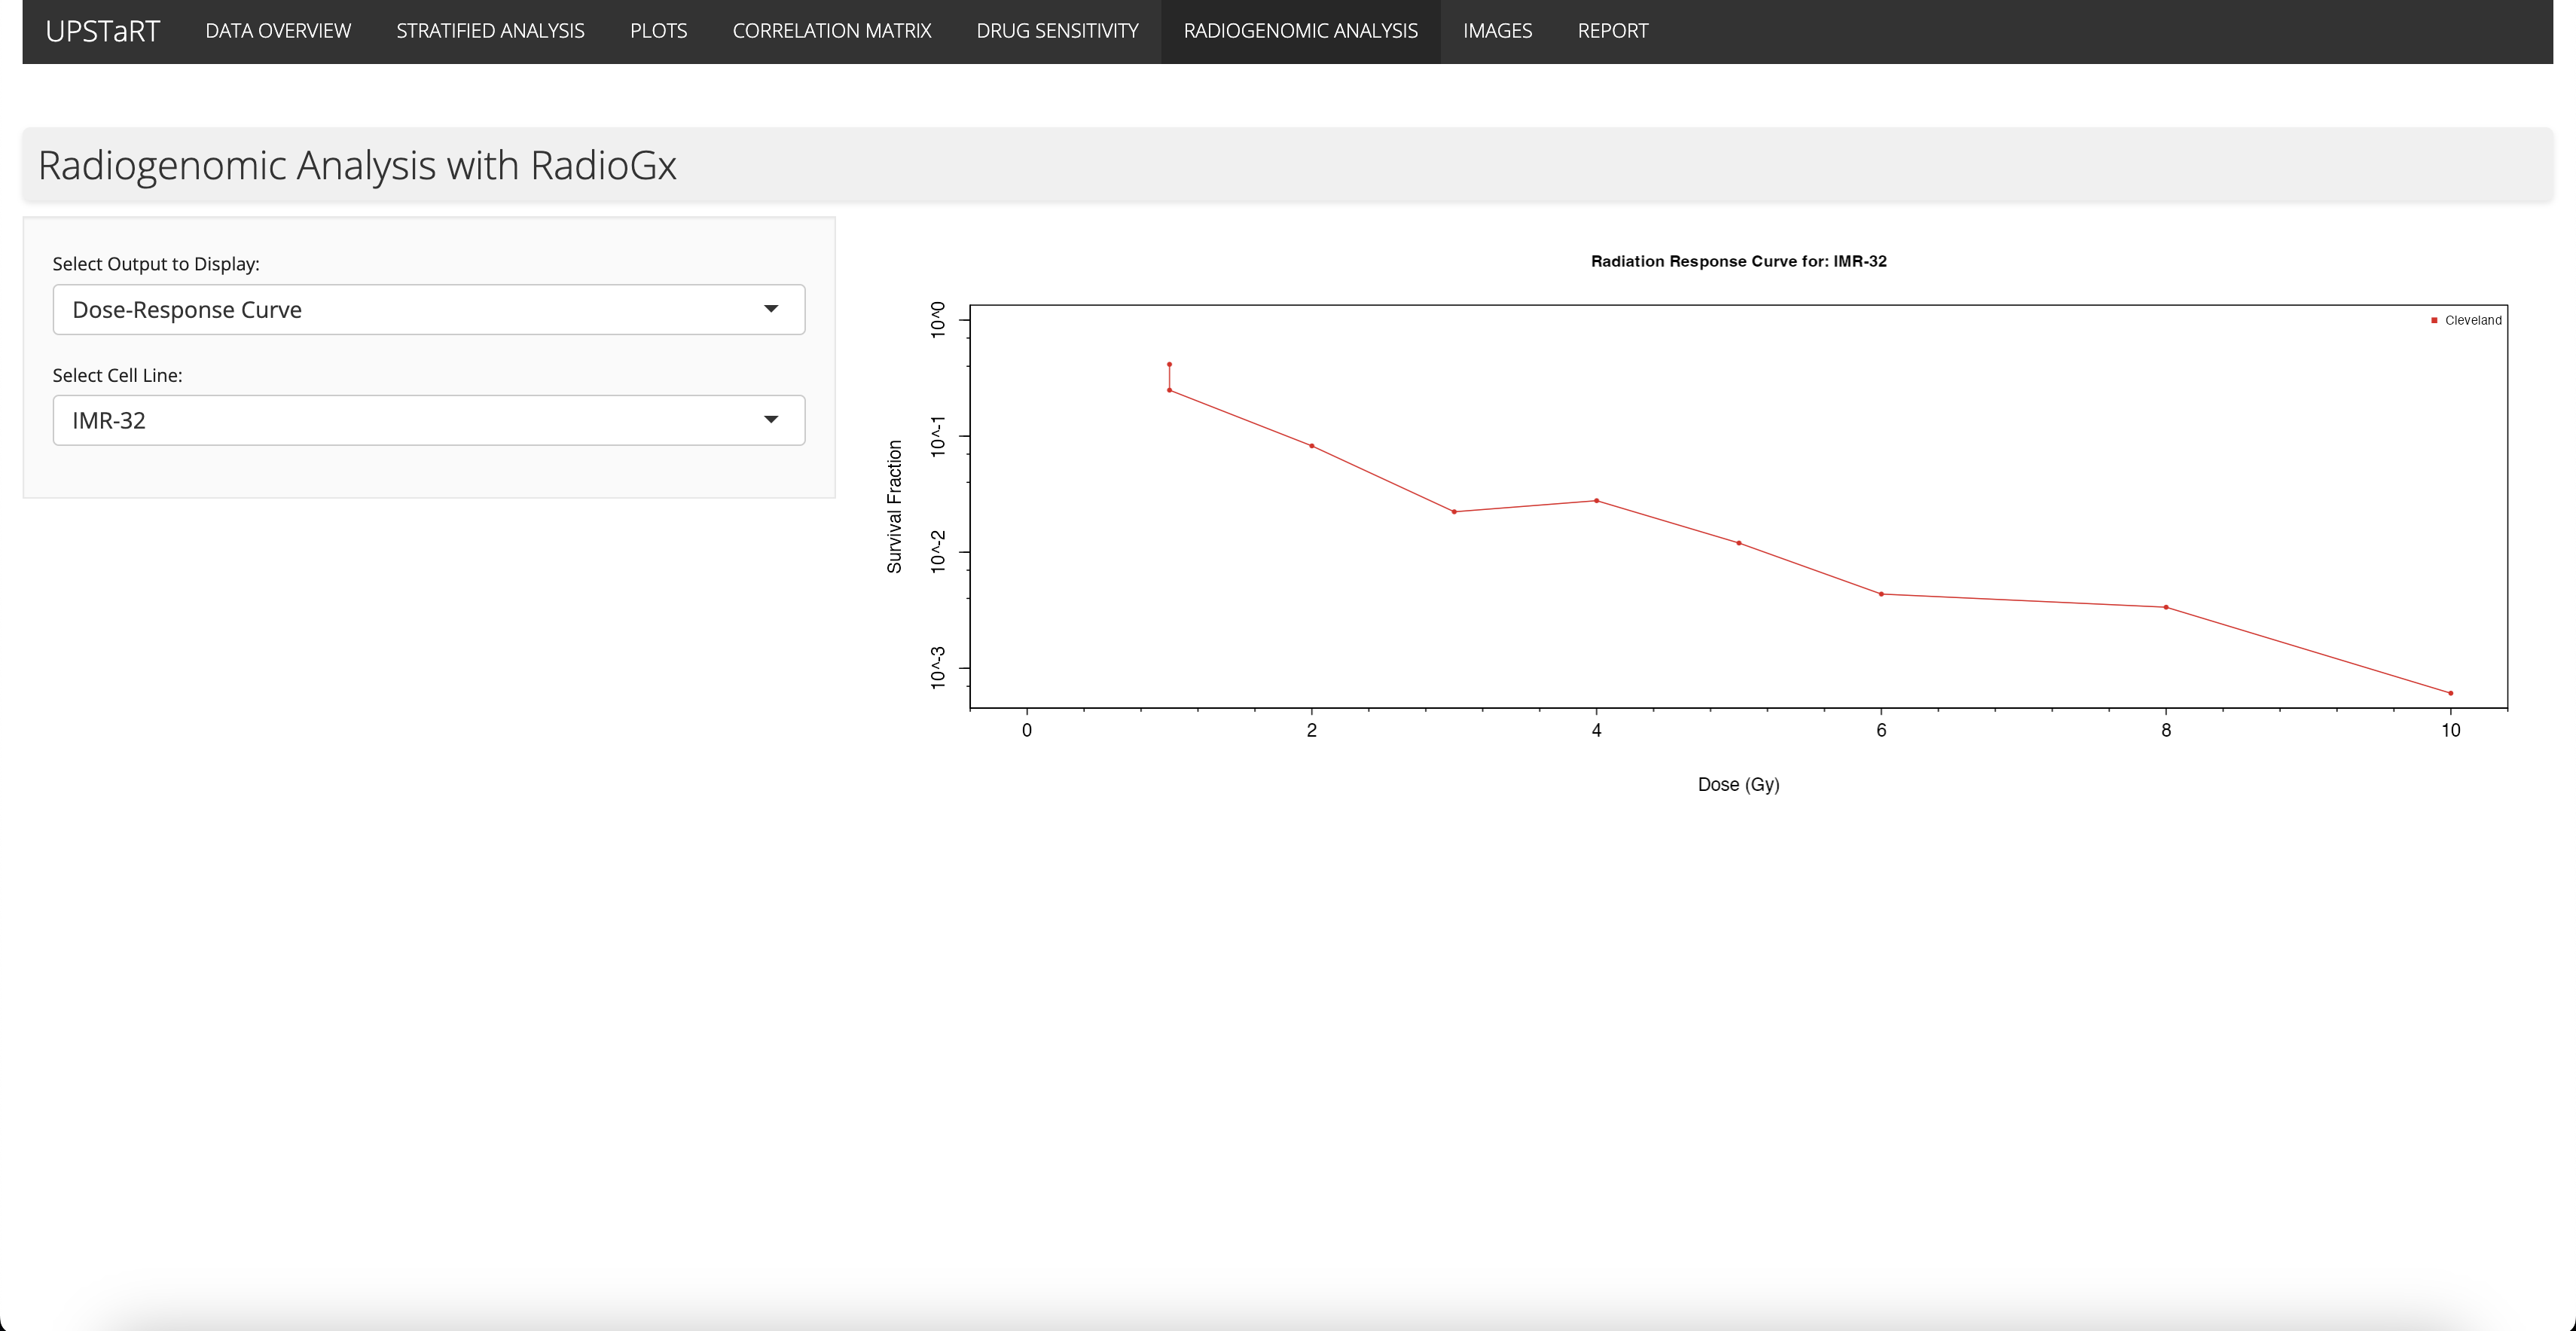
I began exploring the RadioGx and PharmacoGx R Bioconductor packages from BHKLab, which are used for radiogenomic and pharmacogenomic analyses. These tools enable the analysis of how different cell lines respond to radiation and drug treatments, providing insights that could enhance cancer treatment strategies.
15th July - 21th July
I implemented a T-test to compare the drug sensitivity of various drugs, cell lines, or tissue types.
I utilised RadioGx package for comprehensive analysis of cell line responses to radiation, which can be useful when determining the correct dosage for a patient.
There is also the feature of calculating the sensitivity signatures for cell lines based on molecular data, such as RNA expression profiles. The function identifies which molecular features (genes) are associated with the cell lines’ response to radiation. This can be useful for:
- Biomarker Discovery: Identify genes that can serve as biomarkers for predicting radiation sensitivity or resistance in cancer cells
- Combination Therapy: Combine radiation therapy with drugs targeting genes associated with radio-resistance to enhance treatment effectiveness.
- Personalized Medicine: Tailor radiation therapy based on the molecular signatures of a patient’s tumor, improving treatment outcomes.
Week 9 and Week 10 (Pharmacogenomic Analysis and Report)
21st June - 29th July
I utilised PharmacoGx for drug sensitivity analysis showing a drug-response curve for a selected drug and cell line. It also allows for the calculation of drug sensitivity signatures and can be useful when identifying drug sensitivity or resistance biomarkers.
In the final stage of my internship, I focused on single-cell RNA sequencing (scRNA-seq) data analysis using the Seurat package. The key steps included:
- Data Import and Seurat Object Creation:
- We converted the raw expression matrix, including gene expression data, features (genes), and barcodes (individual cells), into a Seurat object for analysis.
- Quality Control
- We filtered out low-quality cells, such as those with low feature counts, low RNA totals, or high mitochondrial gene expression, to ensure that only high-quality cells were included in the analysis.
- Feature Selection:
- We identified highly variable genes across cells, which are critical for distinguishing different cell types.
- Principal Component Analysis (PCA):
- PCA was performed to reduce data dimensionality while preserving variability, helping to identify key sources of variation among cells.
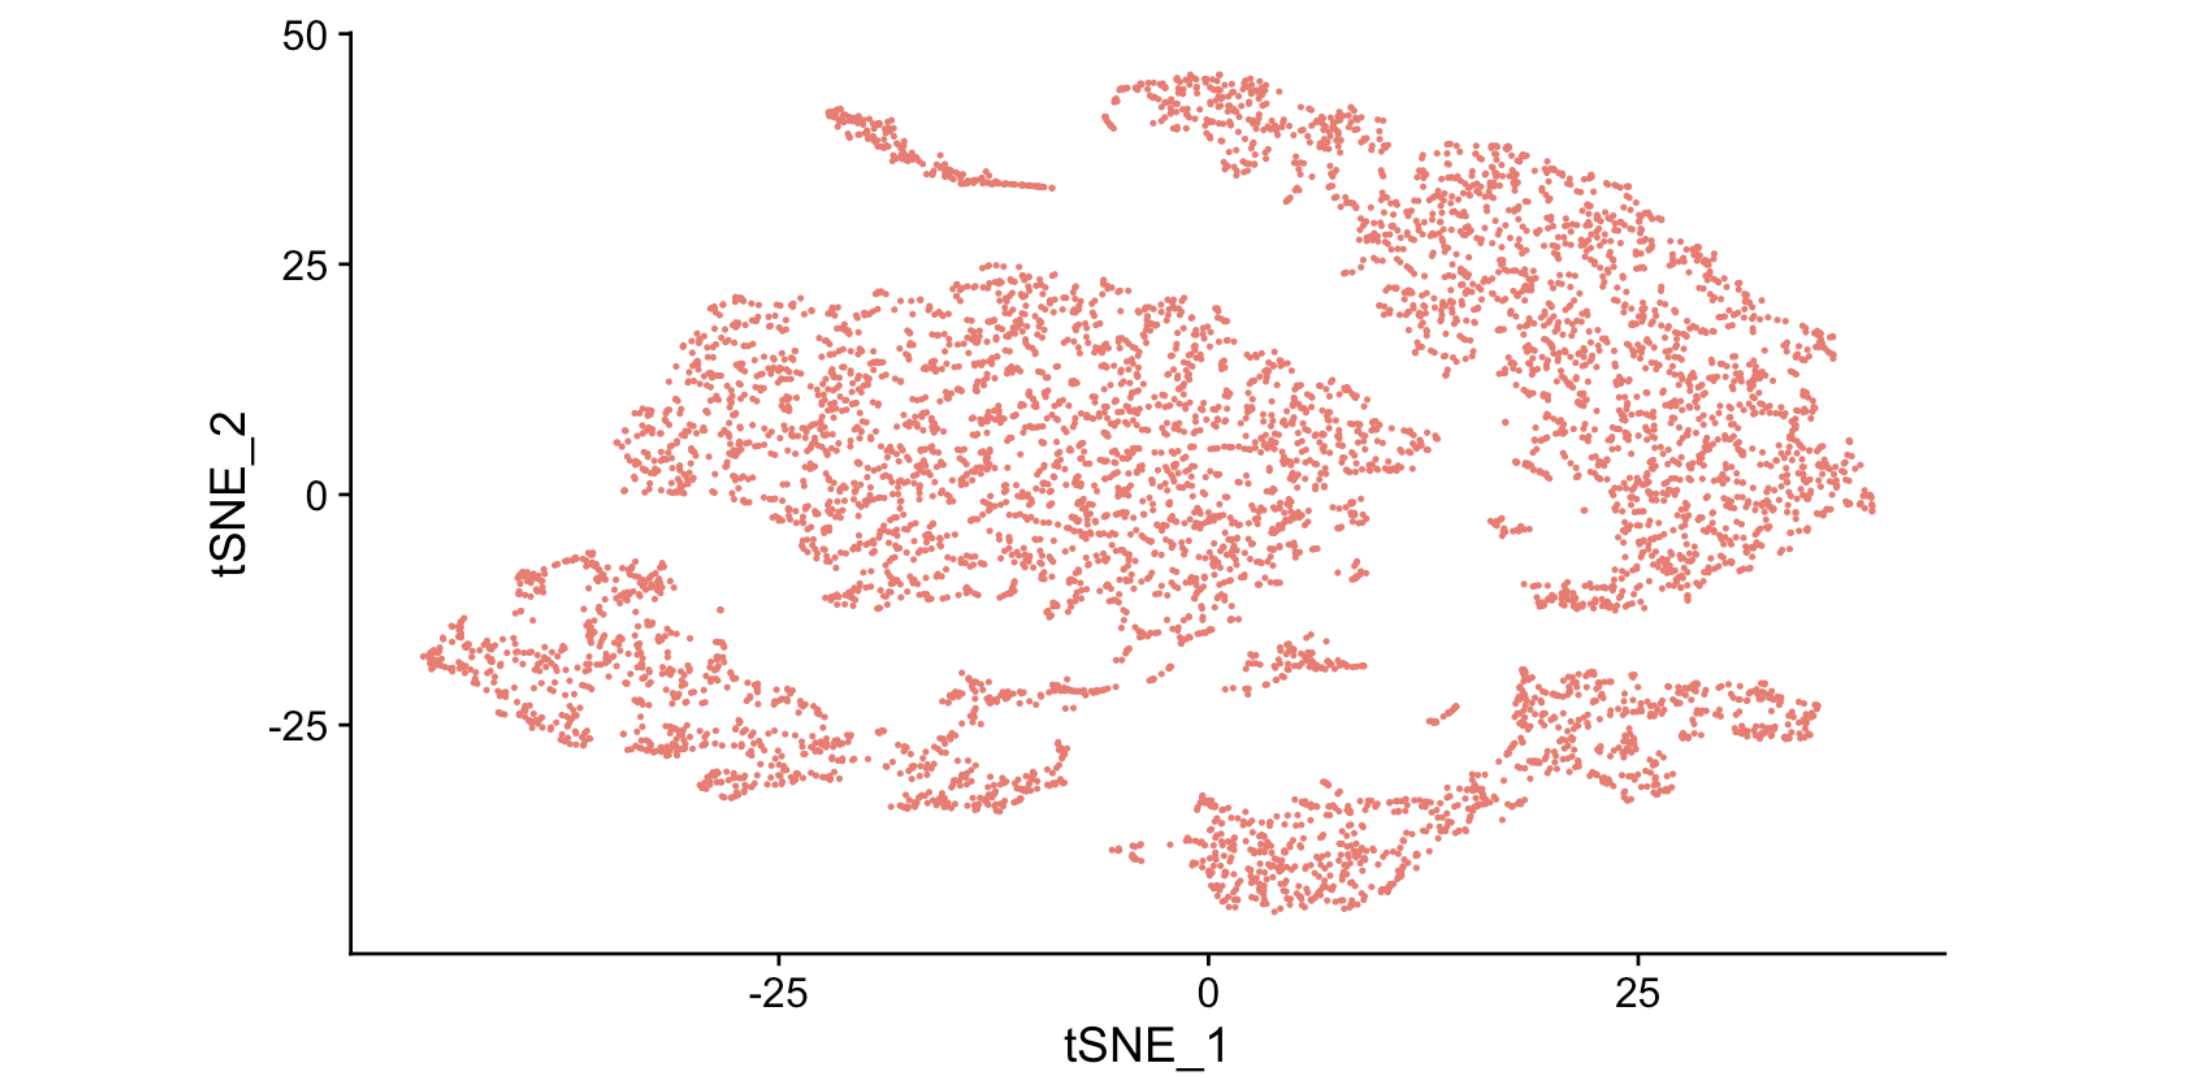
- Dimensionality Reduction and Visualization:
- We used t-SNE and UMAP for visualizing high-dimensional data in two dimensions, enabling the discovery of cell clusters that may represent different cell types or states. These clusters can be explored further for biological interpretation and novel biomarker identification.
29th June - 5th August
In the final week, I focused on finalizing my report, ensuring that all documentation and code were well-organized and accessible.
Results
The outcome of this project is a Shiny App we named DataPulse designed to identify data bias and provide summary statistics. The app offers various functionalities, including interactive plots for clinical datasets, insights into demographic variables (age, gender, survival status, race, and ethnicity), CT scan visualization through a DICOM Viewer, a correlation matrix for numeric clinical data, stratified analysis, and t-test statistics on drug response data (IC50 values). Additionally, the app supports radiogenomic and pharmacogenomic analyses. While we focused particularly on lung adenocarcinoma, the app is useful for pan-cancer research.
The code and resources for this tool are available on its GitHub repository, and the Shiny app can be accessed on shinyapps.io
Final Thoughts
This internship has provided me with invaluable experience in data analysis, tool development, and collaborative research. The skills and insights gained will undoubtedly contribute to my future work in bioinformatics. I look forward to continuing this journey and exploring further opportunities to apply these skills.